At The Research Data Experts, we can help you apply this method to uncover complex relationships in your data, ensuring accurate interpretation and professional reporting.
What is Multiple Linear Regression?
Multiple linear regression is essentially an extension of simple linear regression that models the relationship between one dependent variable and two or more independent variables. This approach allows you to consider the relative impact of each predictor and control for other confounding variables.
For instance, a university researcher may use multiple linear regression to study how study hours, class attendance, and caffeine intake predict students’ GPA. The model, therefore, helps determine which variables significantly affect performance and how strong those effects are.
You can see how, unlike simple linear regression, multiple linear regression can handle more complex models by including several predictors.
The equation of a multiple linear regression model is:
Y = α + β1X1 + β2X2 +…+βeXe + ε
Where:
- Y = Dependent variable (outcome)
- α = Intercept (value of Y when all Xs are 0)
- β1, β2, … βe = Coefficients for each independent variable (X1, X2, … Xe)
- ε = Error term (residuals or unexplained variation)
This model allows us to estimate the effect of each variable while controlling for the others.
When Do we Use Multiple Linear Regression?
Multiple linear regression is ideal when:
- You want to predict a continuous outcome using multiple predictors.
- You need to control for confounding variables in observational research.
- You want to quantify the contribution of each independent variable.
- Your data meets the assumptions of linearity, independence, homoscedasticity, and multivariate normality.
Output and Interpretation
Key outputs from multiple linear regression include*:
- Intercept (α): The predicted value of Y when all predictors (Xs) are zero
- Coefficients (βs): Show how much Y changes for each one-unit increase in X, controlling for other variables.
- R-squared (R2): Proportion of variance in Y explained by all the predictors combined. This output highlights the goodness of fit of the model.
- p-values: Indicate whether each predictor significantly contributes to the model at a set level of confidence (usually 95% or 99%).
- Standardized Beta coefficients: Allow comparison of variable impact, regardless of scale.
* Outputs may vary slightly depending on your software
Example interpretation: If the coefficient of the ‘study hours’ variable is 1.2 (p=0.003), it means that, holding other variables (class attendance and caffeine intake) constant, each additional hour of study is associated with a 1.2-point increase in a student’s GPA, and the effect is statistically significant at the 95% level of confidence.
Visualizing Simple Linear Regression
Visual are often essential to understanding and presenting multiple linear regression results. Common visualizations include:
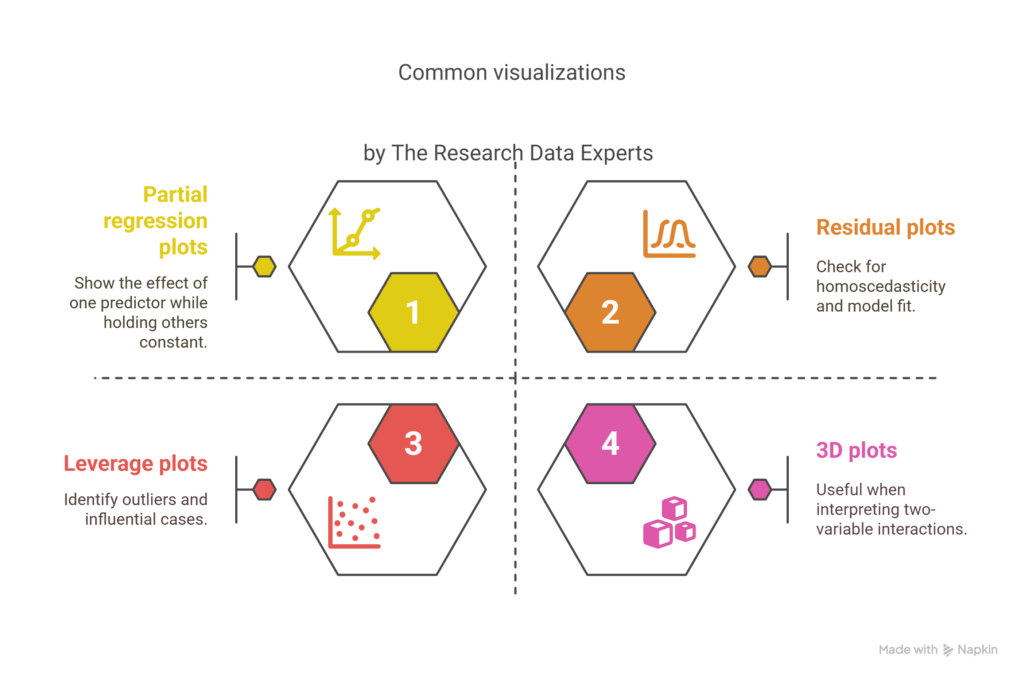
These visualizations help clarify your analysis findings for stakeholders or reviewers.