Our DNP capstone project research experts understand that quality has a significant role in patient health outcomes and resource utilization. As you begin to conduct your DNP quality improvement project it is essential to understand that different factors contribute to the occurrence of a gap between the ideal and existing states of healthcare delivery. As such, quality improvement is essential in ensuring patient outcomes are achieved.
An essential part of the DNP quality improvement process is understanding the root cause of the problem, which makes it essential to develop a fishbone diagram. A fishbone diagram, cause-and-effect diagram, or Ishikawa Diagram can be used to visualize your DNP quality improvement root cause analysis.
Our DNP capstone project research experts can help you construct your quality improvement fishbone diagram. We understand that the DNP fishbone diagram, the head of the fish, which is typically on the right side represents the problem that needs an evidence-based intervention to achieve quality improvement. The problem statement provides the foundation for the DNP quality improvement fishbone diagram. Then, each branch or bone of the diagram corresponds to a major category of causes related to the effect. Our DNP project research experts will brainstorm the major causes and sub-causes to provide a fishbone diagram that can be used to justify the need to conduct a quality improvement project.
Some common categories include methods or systems, people and manpower, environment, material, and measurement. We can provide you with a fishbone diagram that clearly outlines the major and minor causes of the identified problem, supporting your DNP project quality improvement initiative.
Our research data experts understand that the cause-and-effect diagram is a tool that assists in assessing the root cause of a quality-related problem, such as safety incidents or poor performance. Determining the root cause of a practice problem is essential because it prevents focusing on the symptoms.
The advantages of using a fishbone diagram in assessing the root cause for a DNP quality improvement initiative are:
- The cause-and-effect diagram promotes narrowing the scope of the DNP quality improvement initiative, ensuring it is manageable and actionable.
- Developing the Ishikawa Diagram for a DNP quality improvement promotes generating the possible causes that individuals can act upon.
- A fishbone diagram promotes visualizing the relationship between all possible causes of the problem of focus.
Steps of Drawing a Fishbone Diagram for a DNP Quality Improvement Project:
- Choosing the fishbone diagram
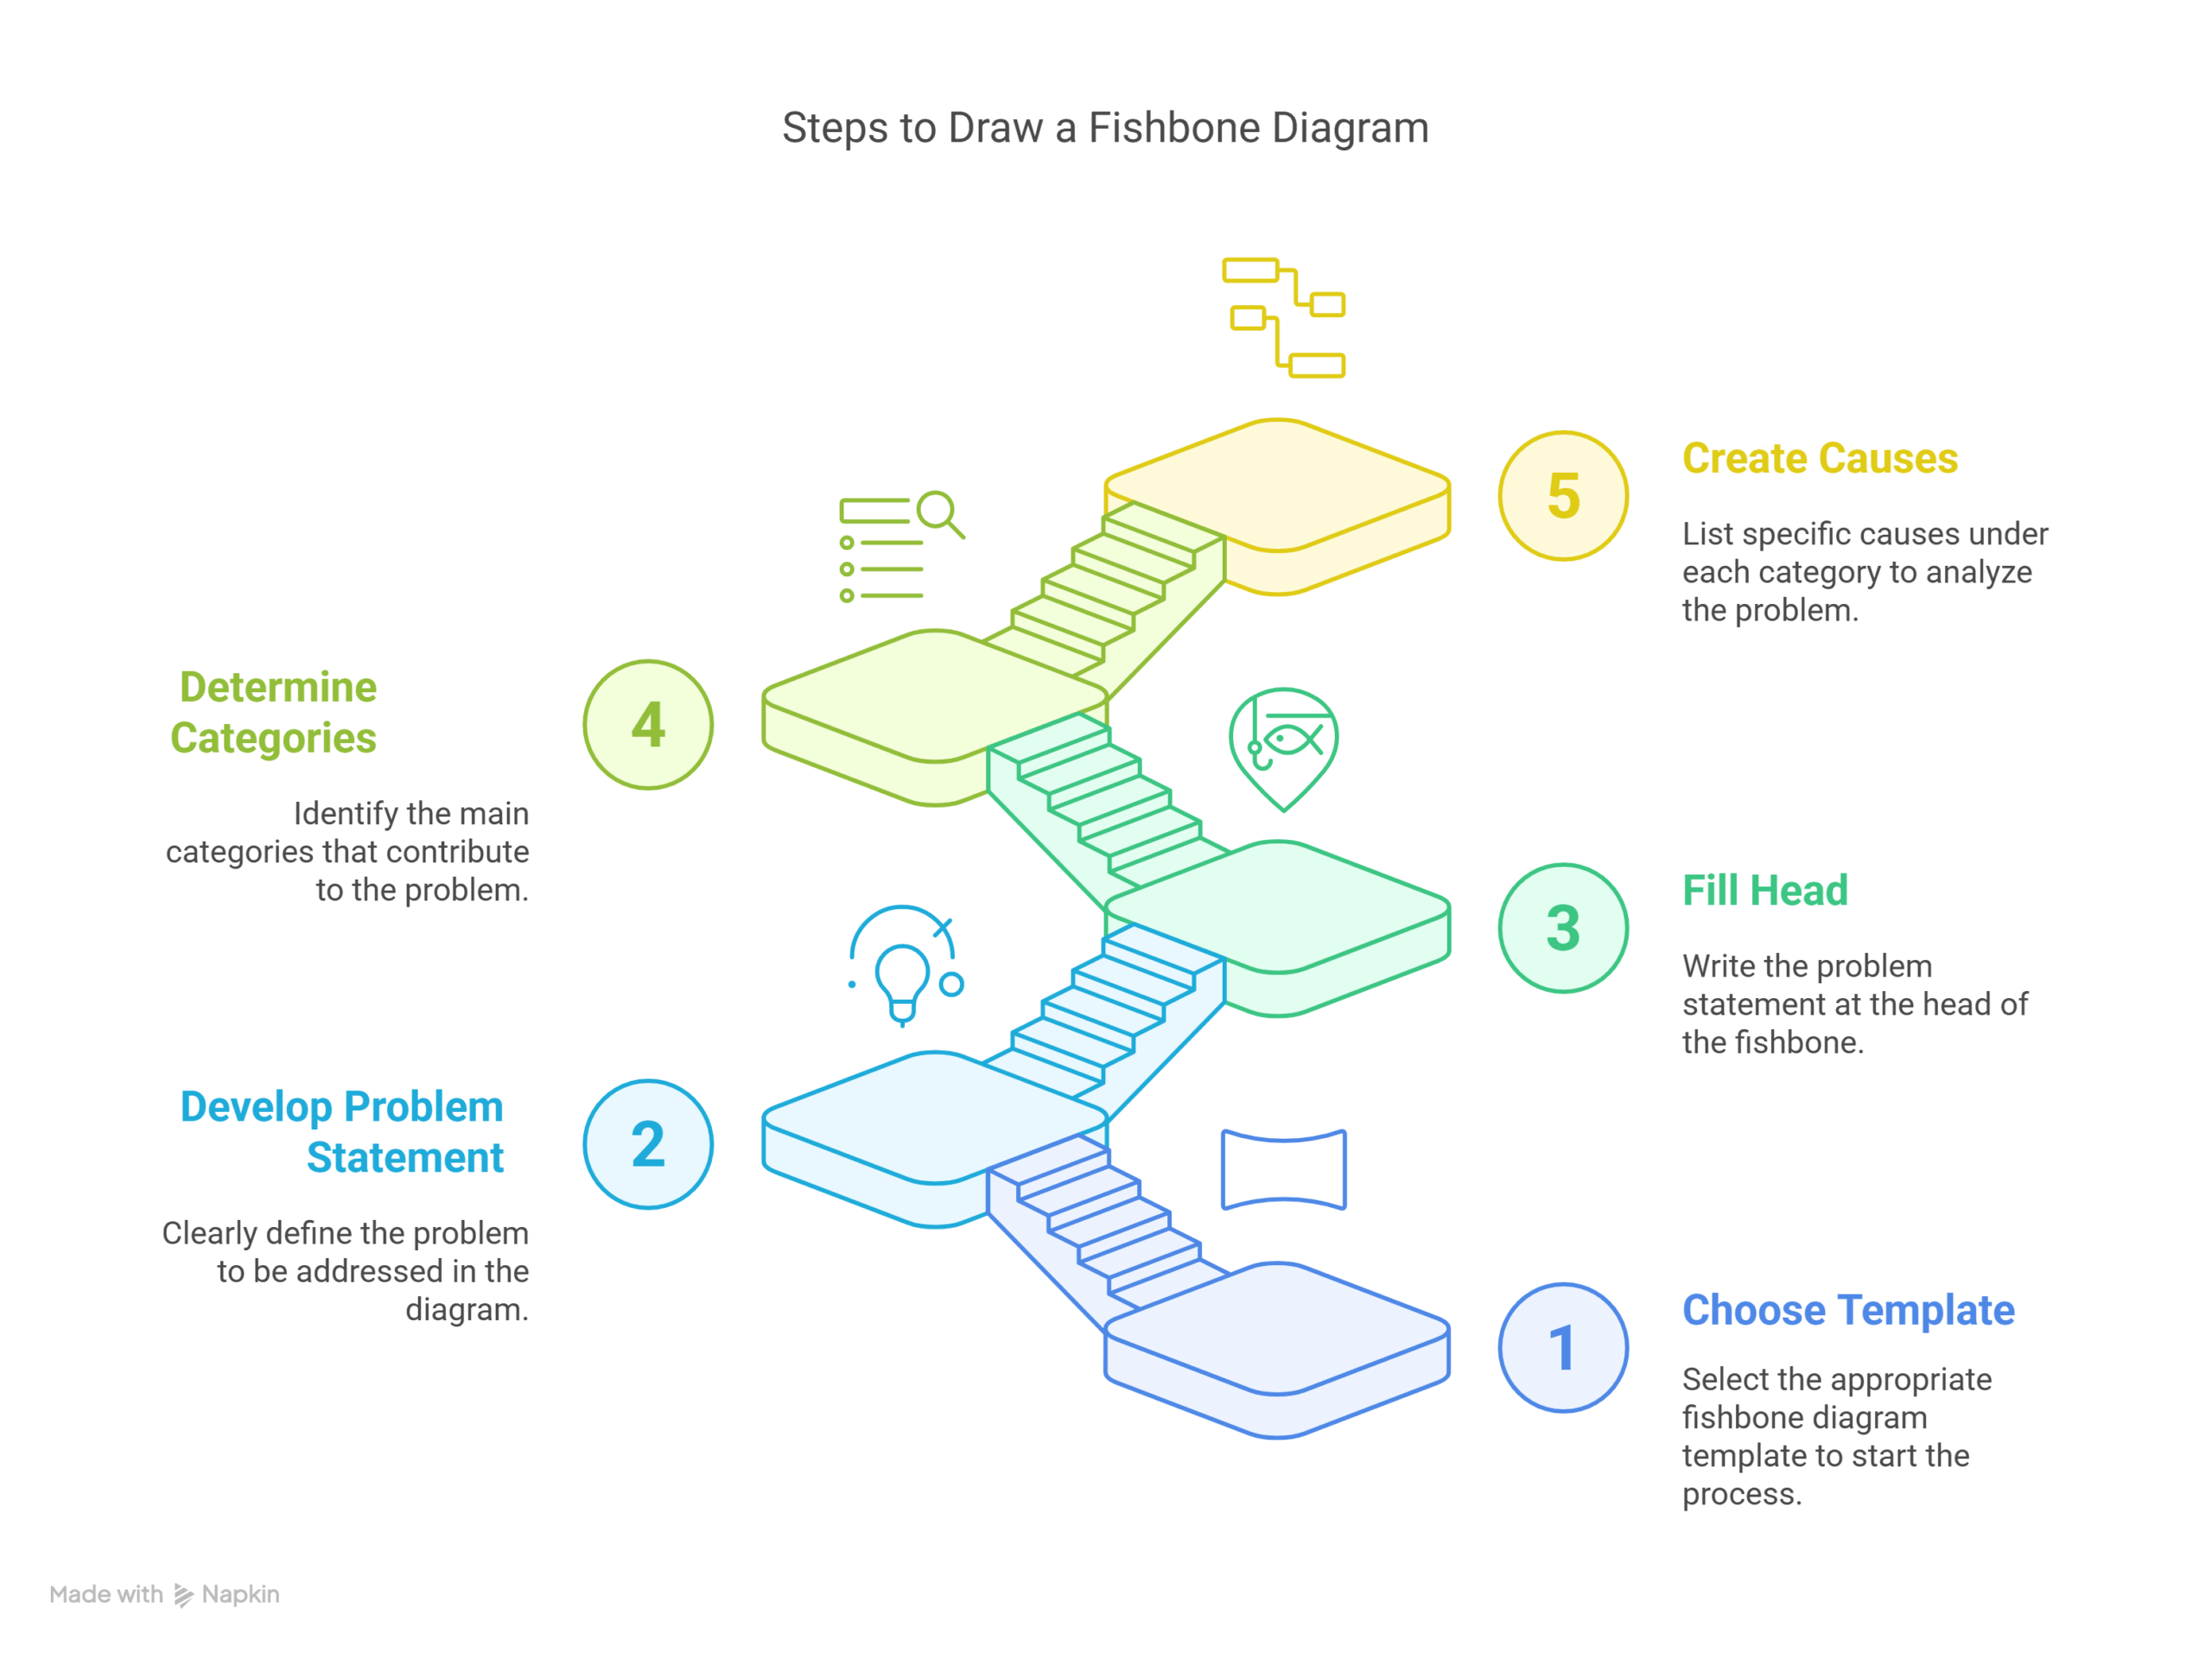 template. Our research experts have different fishbone diagram templates, which we use to tailor to your needs.
 - Developing the problem statement. The experts will appropriately phrase the problem statement, ensuring that it is clear and concise.
- Filling the head of the fishbone diagram. We add the problem statement to the head of the fishbone diagram.
- Determine the categories. The categories focus on the processes and systems. Common categories include procedures, policies, communication, environment, equipment, technology, leadership, and staff support.
- Create causes for each category. We start with a literature review to get ideas about the common causes of the problem in other settings. Then we determine the causes that apply to your clinic or healthcare facility.
Get root cause analysis for your DNP quality improvement project from research data experts.